Taxonomies
The Speeda Taxonomy
Understand how our proprietary taxonomy empowers consistency and comparability




For investment teams operating in Asian markets, industry classification is not merely a reference-data problem; it determines how companies are grouped, which peers are compared, how sector exposures are measured, and ultimately which investment signals become visible.
Broad classification frameworks remain useful for global asset allocation and reporting. However, their macro-level categories can be insufficient for analysing the specialised business models, complex conglomerates, and highly segmented value chains found across Asia, particularly in Japan.
The Speeda Industry Taxonomy provides a more granular foundation for analysis. Built in-house and continuously refined since 2008, the taxonomy maps more than five million public and private companies to 580+ proprietary industries. It is used as a common structural layer across Uzabase datasets and is also available as a standalone data feed.
For hedge funds, systematic investment firms, asset managers, quants, and portfolio managers, the industry taxonomy provides additional precision that supports:
The Industry Classification is a proprietary, three-tiered taxonomy that provides precise classifications for 5+ million public and private companies globally. The taxonomy is structured into 19 sectors and 85 subsectors, under which 580+ proprietary industries are defined.
Each industry is carefully scoped to reflect specific product/service groupings and distinct roles within the value chain, so that companies with similar operating footprints are consistently grouped together, enabling more accurate industry mapping across markets.
The same framework is used across Uzabase datasets, helping users maintain consistent industry definitions when moving between company data, market research, transactions, news, and other linked information.
Company- and Segment-Level Industry Mapping
The taxonomy maps companies to industries at both the consolidated company level and the reporting business segment level.
At the company level, both private and public companies are assigned to industries (and, consequently, sub-sectors and sectors) based on the revenue contribution of their business activities, alongside other guidelines. This revenue-driven approach ensures that the classification reflects the core operations of the company.
At the segment level, disclosed business segments of public companies are mapped to specific industries within the taxonomy. This allows users to examine which parts of a company participate in a particular industry, even when their parent companies would not ordinarily be treated as direct peers. It also allows for more precise comparison or benchmarking of companies within industries.
Multi-Industry Representation
Companies and their business segments are mapped to multiple industries when they operate significant revenue-generating activities across different lines of business. This multi-industry classification design (paired with segment mapping) yields more accurate exposure analysis for conglomerates and other diversified firms.
Global legacy taxonomies are built for broad comparability and may not offer the operational resolution required for specialised security selection, peer construction, or value-chain analysis. Speeda industry taxonomy provides an additional analytical layer by separating companies according to narrower products, services, operating models, and positions within the value chain.
Furthermore, standard Western-centric industry taxonomies are built around North American and European equity markets. As a result, they struggle to capture the operational realities of Asia and Japan, where corporate structures, listing practices, and value chains operate under fundamentally different dynamics.
Thus, by forcing specialised regional players into broad, generic buckets, legacy taxonomies obscure critical nuances, leading to inaccurate benchmarking and misaligned peer groups. Uzabase bridges this gap by offering a truly global taxonomy that combines universal market coverage with regional value-chain precision. Fully compatible across Western, European, and global equity markets, Speeda industry taxonomy allows users to maintain standardised global analysis while delivering the deep, granular categorisation required to reflect how Asian companies actually operate.
Value-Chain Granularity in Action: Semiconductors & Electronics
Legacy Approach: Typically group most semiconductor products into a single ‘Semiconductors & Semiconductor Equipment’ category, and many electronics manufacturers into generic ‘Electronic Components’ groupings.
Issue: In Asia, however, a significant number of companies specialise in highly specific parts of the semiconductor and electronics value chain.
Uzabase’s Approach: Speeda’s taxonomy follows the actual value chain, distinguishing, for example, between memory, logic, power and discrete semiconductors; between fabless players, wafer fabs, and assembly/testing houses; and between upstream materials (wafers, crystalline silicon, photomasks) and downstream electronic components (sensors, PCBs, batteries, LED chips, photovoltaic cells). As a result, each of these segments is classified as a separate industry.
Business Model Differentiation in Action: Transportation & Supply Chain
Legacy Approach: Separates basic modal transport (air, sea, rail) but groups diverse supply-chain services under broad ‘Logistics’ labels.
Issue: In Asia, transportation networks rely on distinct operating models, ranging from tech-enabled mobility platforms and specialised cold-chain logistics to hyper-dense last-mile delivery, that operate under fundamentally different revenue drivers and asset profiles.
Uzabase’s Approach: Speeda’s taxonomy categorises companies by operational model and service niche, distinguishing, for example, between asset-light ride-hailing platforms and traditional taxi operators; between temperature-controlled cold chains and standard commercial logistics; and between urban last-mile express couriers and cross-border freight forwarders. As a result, each of these operational models is classified as a separate industry.
Industry Taxonomy Evolution: Periodically Updated to Reflect Changing Markets
Granularity is useful only when classifications are consistent, explainable, and maintained over time. The Speeda Taxonomy has been developed internally and refined since 2008.
The Speeda industry creation process involves:
Lorem ipsum dolor sit amet, consectetur adipiscing elit, sed do eiusmod tempor incididunt ut labore et dolore magna aliqua. Ut enim ad minim veniam, quis nostrud exercitation ullamco laboris nisi ut aliquip ex ea commodo consequat. Duis aute irure dolor in reprehenderit in voluptate velit esse cillum dolore eu fugiat nulla pariatur.
Block quote
Ordered list
Unordered list
Bold text
Emphasis
Superscript
Subscript
Industry Taxonomy Evolution: Periodically Updated to Reflect Changing Markets
Granularity is useful only when classifications are consistent, explainable, and maintained over time. The Speeda Taxonomy has been developed internally and refined since 2008.
The Speeda industry creation process involves:
1. Establishing high-level sectors that are clearly delineated and non-overlapping.
2. Breaking these sectors down into sub-sectors using shared products, services, technologies, and customer groups as organising principles.
3. Defining industries around distinct economic activities, ensuring each category reflects a specific business model or value-chain role. Clear industry scope is essential for avoiding arbitrary peer-group construction. It establishes the boundaries for deciding which companies should be included, which should be excluded, and how adjacent industries differ.
4. Conducting periodic (quarterly) reviews of the overall industry tree to incorporate emerging industries, identify industry segments that can be spun-off as new industries, and restructure existing sectors/ sub-sectors/ industries in line with market developments.
This approach results in a taxonomy that is both conceptually rigorous and practically aligned with how companies are structured and compete.
Company and Segment Mapping: Combines Technology with Analyst Oversight
Uzabase’s company-mapping process combines algorithms with human analyst oversight. This dual approach, analyst-led mapping complemented by clearly labelled algorithmic mapping, enables broader coverage while preserving transparency about data provenance and classification reliability.
Manual Mapping by Analysts
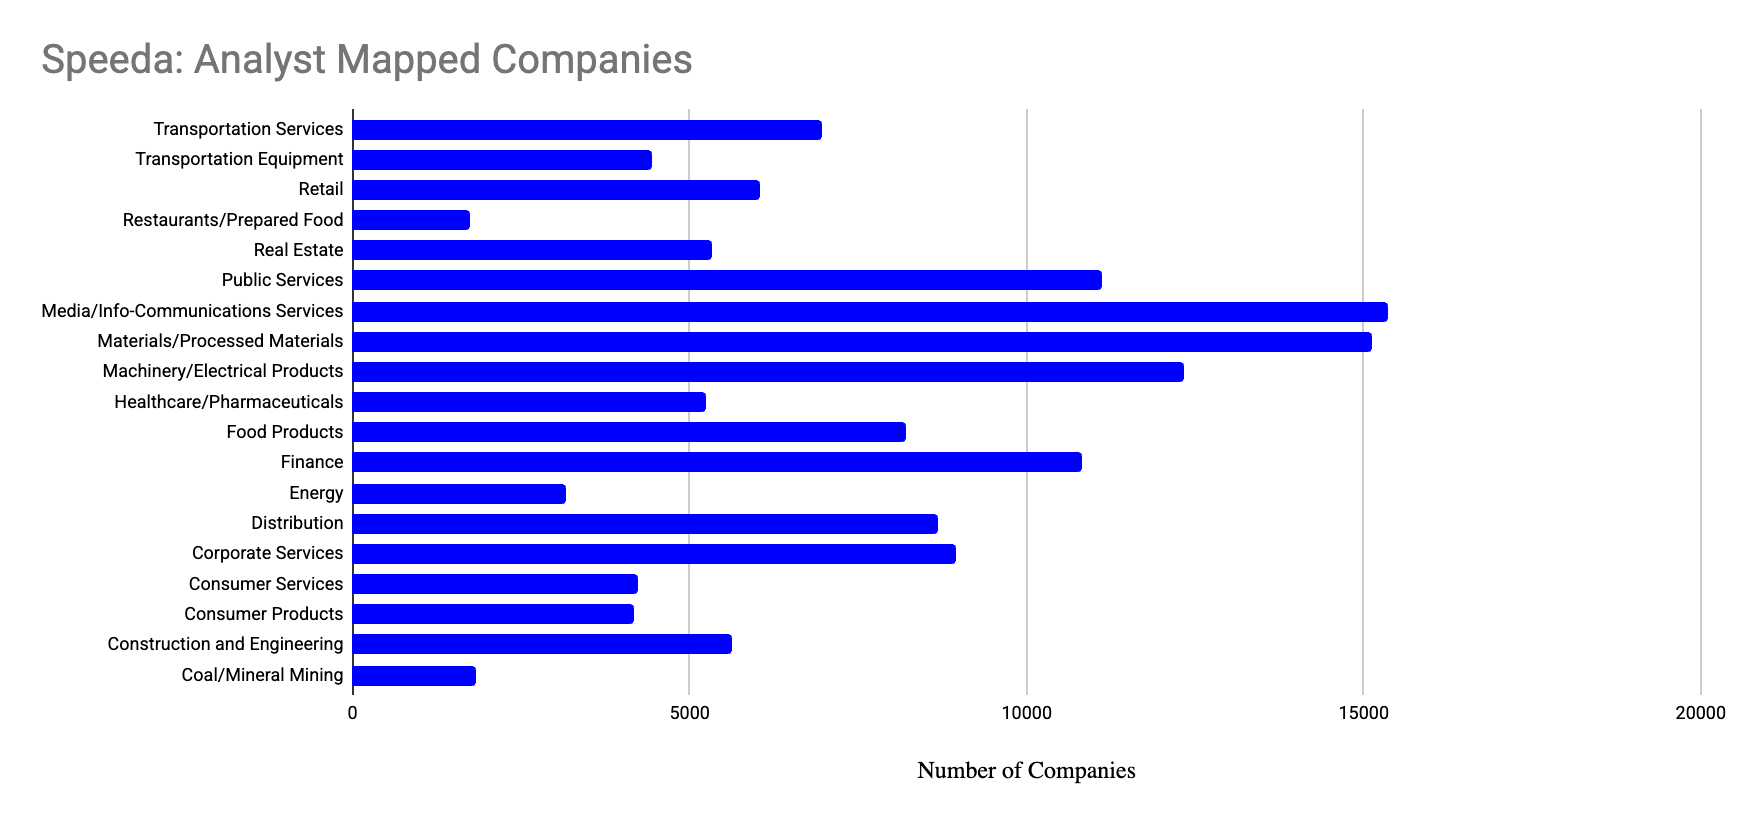
Analysts assign industries to both private and public companies, and to segments of public companies, based on their disclosed activities and revenue drivers. The Industry Taxonomy includes nearly 116,000 analyst-mapped companies.
Uzabase applies standardised mapping guidelines to ensure consistent industry classifications across companies, enabling accurate peer comparisons. Companies are mapped to industries based on three key principles alongside other guidelines, rather than simply mapping every activity over a fixed threshold:
- Whether the revenue from the business activity that falls within the scope of the industry accounts for more than 20% of overall company revenue. Revenue contribution provides an economically grounded basis for determining a company’s most significant activities.
- Even if the business activity does meet the above criteria, if they are a leading player in that specific industry in the geographic region they operate in, then a company would be mapped to the industry.
- However, if most players, including leading players, are pure players in a specific industry, heavily diversified players such as conglomerates are not mapped to the industry even though it meets the other two criteria, as it would make the company an outlier
Put together, these principles result in a classification that is materiality-based, leadership-aware, and peer-set sensitive.
Dedicated mapping projects are conducted each quarter to expand the scope of analyst-verified industry mapping and increase overall coverage. The mapped companies for each industry for major markets covered are reviewed periodically to revise mapping based on company factors (such as M&A, divestitures, and entering new businesses). Changes to the reported business segments of public companies in Uzabase’s core markets are reviewed on a quarterly basis to ensure that segment classifications remain up to date.
Algorithm Mapping
Uzabase uses a machine learning-based industry mapping algorithm to estimate the most relevant industry for companies that have not yet been reviewed by analysts. Uzabase includes around 5.6 million algorithm-mapped companies.
Trained on existing analyst mappings, the model draws on multiple data points, including company descriptions, company and segment names, SIC codes, and other attributes, to identify the best-fit industry.
With an internal accuracy of approximately 60–70%, the algorithm provides a useful starting point for identifying potential peers and industry exposure, though it is intended to complement, rather than replace, analyst classification.

Executing Event-Driven & Long/Short StrategiesThe Uzabase Advantage
The 3-level taxonomy provides granular value-chain depth. When a catalyst hits, investment teams can isolate micro-sectors to construct targeted pair-trades, going Long on direct beneficiaries and Short on vulnerable counterparties.
Sourcing M&A, JV, and Strategic Partnerships
Speeda links news and M&A activity directly to structured company profiles, enabling users to see M&A, joint ventures, and strategic partnerships within specific industries and regions without manually sifting through large numbers of loosely related companies. This integrated view supports faster and more accurate target screening and helps uncover niche, highly compatible “hidden gems” that traditional, high-level classifications are likely to overlook.
Conducting Accurate Competitor Studies & BenchmarkingSpeeda offers "apples-to-apples" benchmarking by grouping companies with identical revenue drivers and operational realities across its 580-plus industries. Multi-industry tagging also allows users to map out conglomerates accurately. The result is competitive intelligence through peer comparisons that truly reflect commercial reality.
Improving Portfolio & Factor AnalyticsSpeeda’s granular, value-chain-based industry tags provide a more economically coherent sector and industry structure for portfolio construction and risk models. This allows investment teams to separate true peers from superficially similar names, leading to cleaner factor signals, more intuitive sector and style exposures, and sharper attribution of performance and risk at the industry and theme level.
Building and Monitoring Thematic Exposures
Speeda enables precise construction and monitoring of thematic baskets, such as EVs, battery storage, data centres, logistics infrastructure, or digital health, by mapping companies across the full value chain. Users can identify upstream suppliers, core operators, and downstream service providers in separate, clearly labelled industries, rather than relying on high-level sector codes that blur these distinctions.
Structuring Data & AI Models
Speeda’s taxonomy can be used as a structured labelling layer for machine learning and AI applications, such as company similarity, clustering, or recommendation engines. Granular industry tags and segment mappings provide high-quality features and labels that improve model precision and interpretability, compared with noisy or overly broad legacy classifications.
Visit the Speeda Industry Taxonomy product page to learn how the framework connects companies, markets, and datasets across Asia and the global economy. Contact the Uzabase team to request the Content Methodology Guide, review sample data, discuss delivery options, or evaluate how the taxonomy can be integrated into your research, portfolio, or data architecture.
© 2025 Uzabase, Inc. All rights reserved.